What Is Year-Over-Year (YOY)?
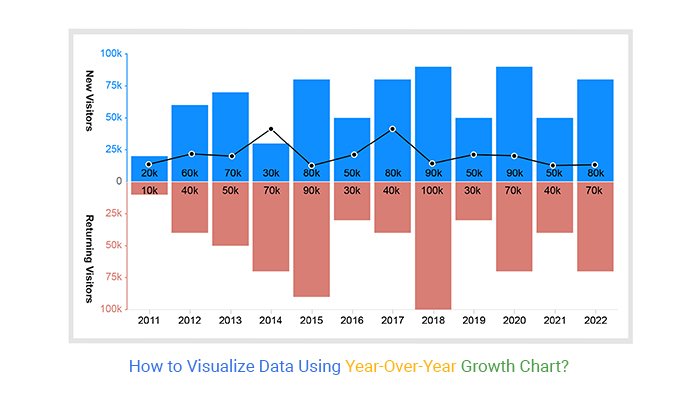
Year-over-year (YOY)—sometimes referred to as year-on-year—is a frequently used financial comparison for looking at two or more measurable events on an annualized basis. Observing YOY performance allows for gauging if a company’s financial performance is improving, static, or worsening. For example, you may read in financial reports that a particular business reported that its revenues increased for the third quarter on a YOY basis for the last three years.
KEY TAKEAWAYS
- Year-over-year (YOY) is a method of evaluating two or more measured events to compare the results at one period with those of a comparable period on an annualized basis.
- YOY comparisons are a popular and effective way to evaluate the financial performance of a company.
- Investors seeking to gauge a company’s financial performance use YOY reporting.

Understanding Year-Over-Year (YOY)
Year-over-year compares a company’s financial performance in one period with its numbers for the same period one year earlier. This is considered more informative than a month-to-month comparison, which often reflects seasonal trends.
Common YOY comparisons include annual and quarterly as well as monthly performance.
Benefits of Year-Over-Year (YOY)
YOY measurements facilitate the cross-comparison of sets of data. For a company’s first-quarter revenue using YOY data, a financial analyst or an investor can compare years of first-quarter revenue data and quickly ascertain whether a company’s revenue is increasing or decreasing.
By comparing the same months in different years, it is possible to draw accurate comparisons despite the seasonal nature of consumer behavior. This YOY comparison is also valuable for investment portfolios. Investors like to examine YOY performance to see how performance changes over time.
Uses of Year-Over-Year (YOY)
YOY comparisons are popular when analyzing a company’s performance because they help mitigate seasonality, a factor that can influence most businesses. Sales, profits, and other financial metrics change during different periods of the year because most lines of business have a peak season and a low-demand season.
For example, retailers have a peak demand season during the holiday shopping season, which falls in the fourth quarter of the year. To properly quantify a company’s performance, it makes sense to compare revenue and profits YOY.
It’s important to compare the fourth-quarter performance in one year to the fourth-quarter performance in other years. Suppose an investor looks at a retailer’s results in the fourth quarter versus the prior third quarter. In that case, it might appear that a company is undergoing unprecedented growth when seasonality influences the difference in the results.
Similarly, in a comparison of the fourth quarter with the following first quarter, there might appear to be a dramatic decline, when this could also be a result of seasonality.
YOY also differs from the term sequential, which measures one quarter or month to the previous one and allows investors to see linear growth. For instance, the number of cell phones a tech company sold in the fourth quarter compared with the third quarter or the number of seats an airline filled in January compared with December.
Example of Year-Over-Year (YOY)
Below is Apple’s income statement from Q2 2024. Total net sales for the second quarter were $90.8 billion. Total net sales for the second quarter of 2023 were $94.8 billion. This means that Apple’s net sales in Q2 2024 were down 4.3% year-over-year (YOY).1
For Q2 2024, Apple’s net income was $23.6 billion, which was a decrease compared to its net income of $24.2 billion in Q2 2023. This was a 2.2% decrease year-over-year.1
What Is YOY Used For?
YOY is used to compare one time period and another one year earlier. This allows for an annualized comparison, say between third-quarter earnings this year versus third-quarter earnings the year before. It is commonly used to compare a company’s growth in profits or revenue, and it can also be used to describe yearly changes in an economy’s money supply, gross domestic product (GDP), and other economic measurements.
More Content:
- College Se TC Lene Ke Liye Application Kaise Likhe
- Office Se Chutti Ke Liye Application Kaise Likhe Hindi Aur English Me
- SBI Se Business Loan Kaise Le: SBI Business Loan Best Guide in Hindi 2022
How Is YOY Calculated?
YOY calculations are straightforward and usually expressed in percentage terms. This would involve taking the current year’s value dividing it by the prior year’s value and subtracting one: (this year) ÷ (last year) – 1. You can then multiply this by 100 to get a percentage.
What’s the Difference Between YOY and YTD?
YOY looks at a 12-month change. Year-to-date (YTD) looks at a change relative to the beginning of the year (usually Jan. 1). YTD can provide a running total, while YOY can provide a point of comparison.
What if I Am Interested in Comparisons of Less Than a Year?
You can compute month-over-month or quarter-over-quarter (Q/Q) in much the same way as YOY. Indeed, you can choose any time frame you desire.
The Bottom Line
Year-over-year (YOY) is a useful tool for financial analysts, corporations, and investors. It allows for the comparison of financial figures from one point in time to the same point a year prior. It paints a clear picture of performance—whether performance is improving, worsening, or static.
This informs companies on how their business is operating and if changes need to be made. It informs investors if their portfolio needs adjustment and analysts use it to describe the financial health of a company and make future predictions.


